TMH 9 visual assessment software
See the road.
Read the data.
RoadSense places every survey frame at the position it was taken, then brings the survey readings for that position alongside it. In Visual Assessor an assessor sees the road and its measurements at one chainage, and rates the condition on TMH 9 forms.
- TMH 9 compliant rating forms · Parts B, D, E (COTO, May 2016)
- TMH 13 compliant imaging · Part G, frames every 5 m
- Signed by a registered Professional Engineer (Pr Eng, ECSA)
67 s film. The road footage is a real RoadSense survey video (R33). The user interface is Visual Assessor 1.0.120 with its training dataset; road identifiers and map coordinates are masked. Transcript
What
Imagery on the survey line
A survey video is more than footage. It carries the vehicle’s GPS, so every frame can be given a place on the road. RoadSense keeps one frame at each distance station along the drive, and the survey’s readings sit on the same road. Visual Assessor shows them together.
- Capture
Video + GPS
Front, side and back cameras record the road. The GoPro files carry their own GPS track.
- Place
Frames at stations
One frame is kept at each station along the GPS track, with its distance, video time and coordinates. Current Tower intake keeps one every 5 m.
- Link
Readings on the register
IRI, MPD, SMTD, rut and FWD readings are loaded for the same road and mapped onto the frames’ chainage.
- Assess
Side by side
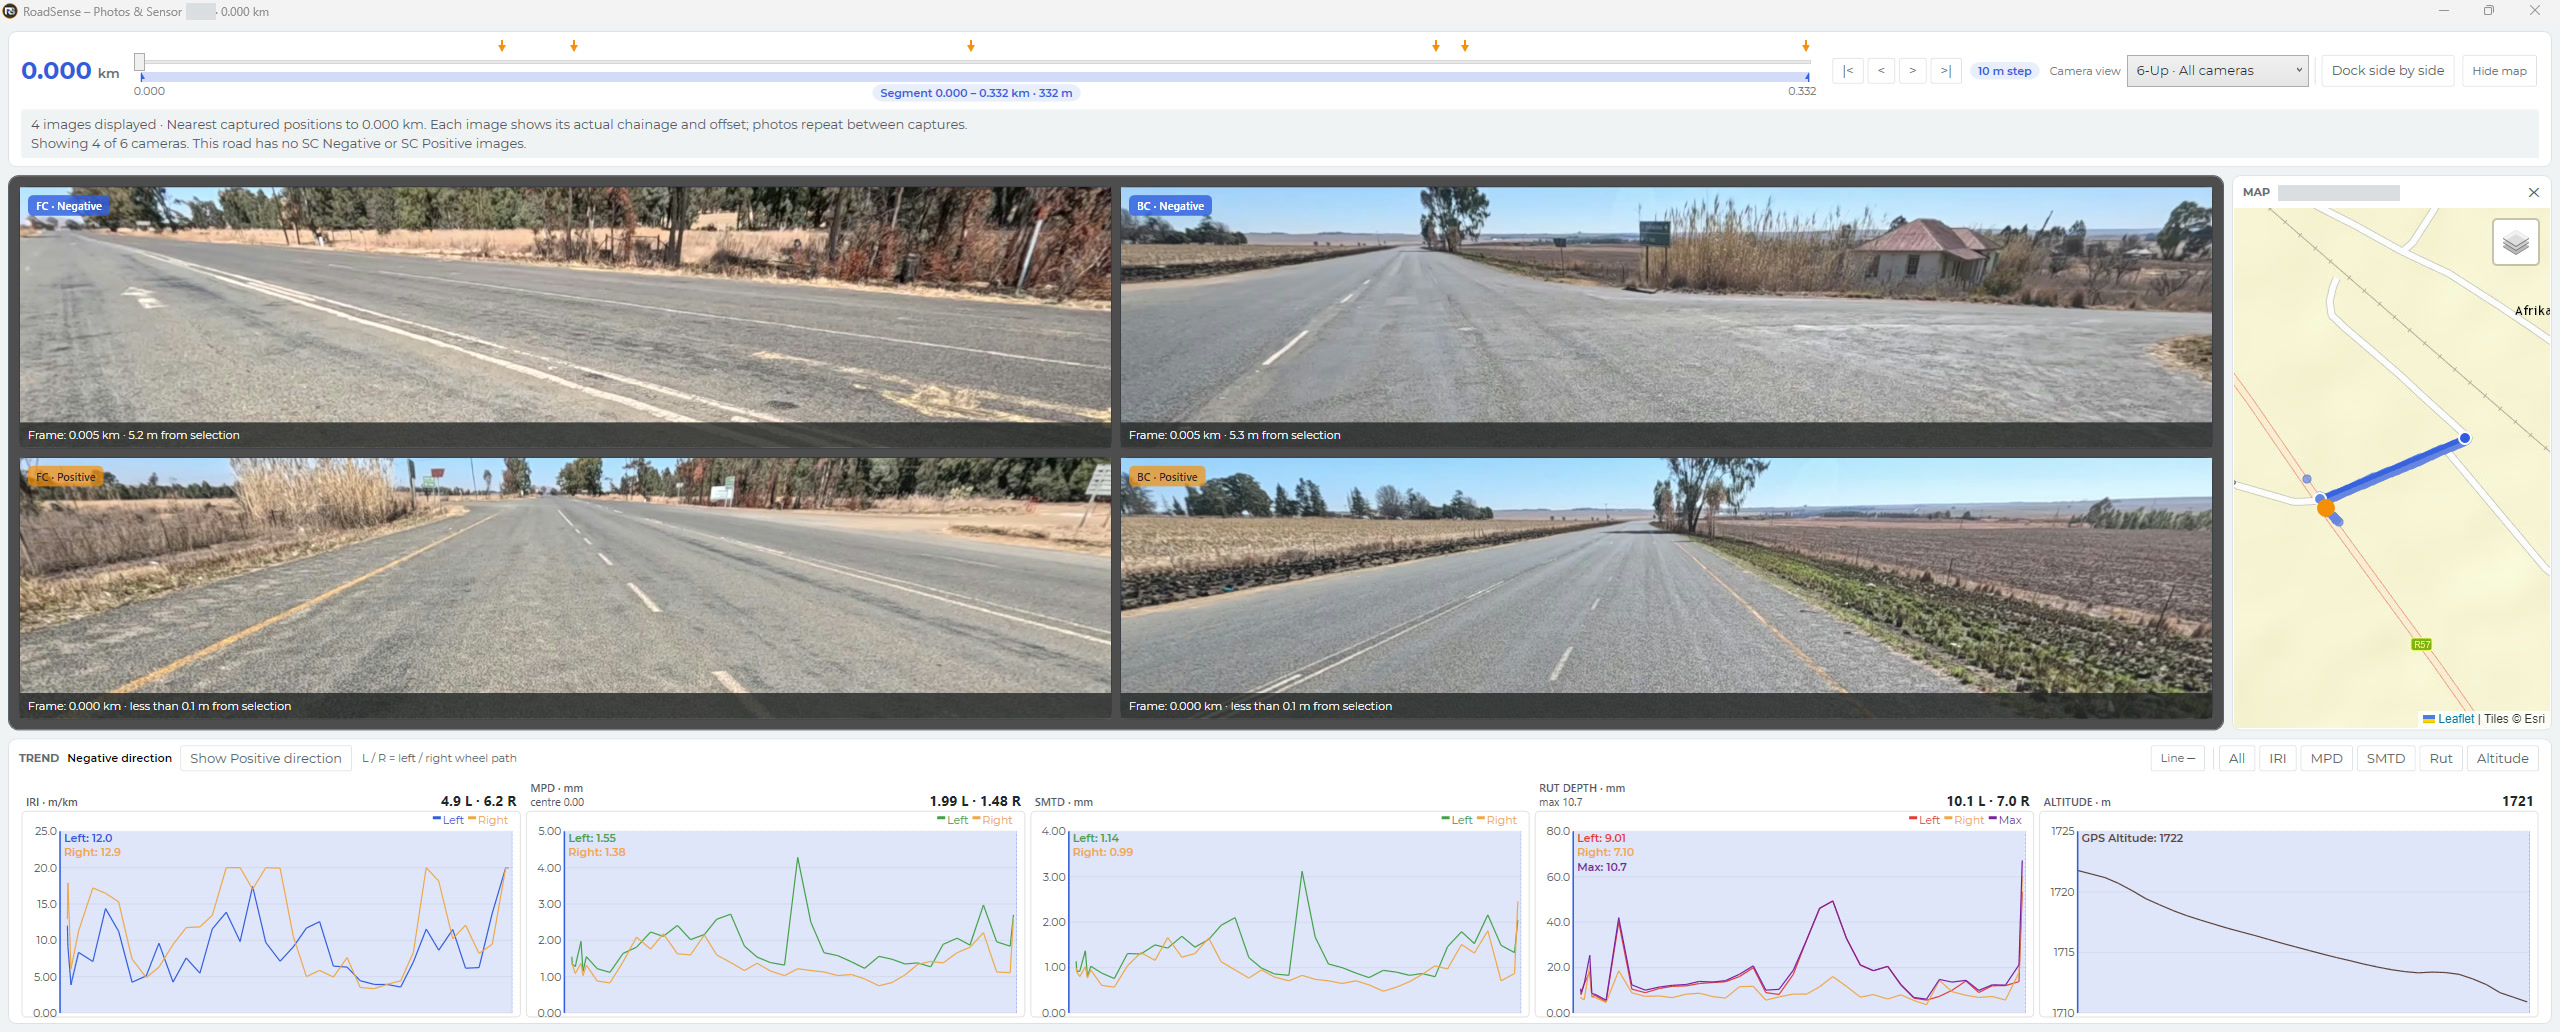
Visual Assessor shows every camera, the map and the trend charts at one selected chainage.
- Record
Assessment record
The assessor rates each distress by degree and extent on the TMH 9 form for the pavement type.
- Report
Reporting
Finalised records upload to the RoadSense platform. A road’s Assessment tab lists its assessments through the register.
A worked example: 70 m of the R33
Back camera, frame run at 5 m · every second frame shown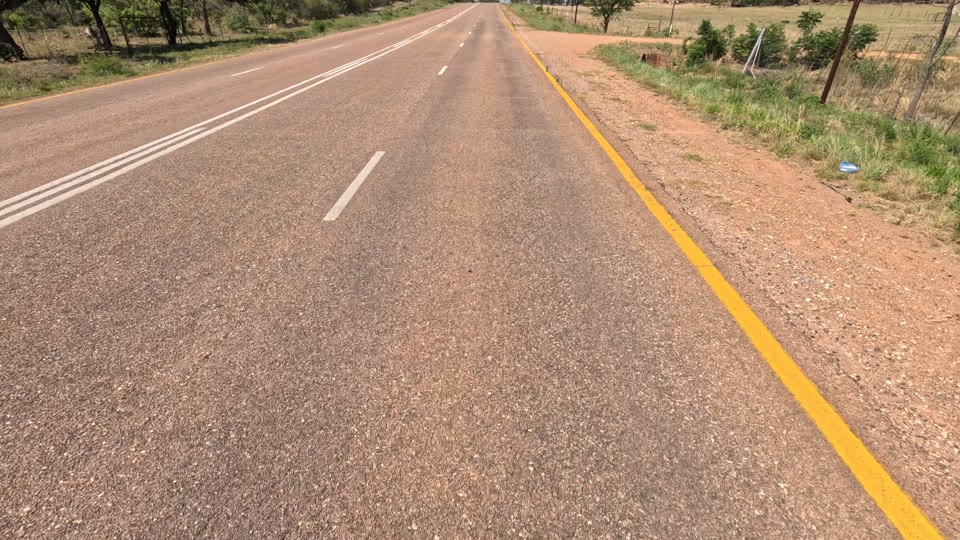
Rut 5.0 · 2.9
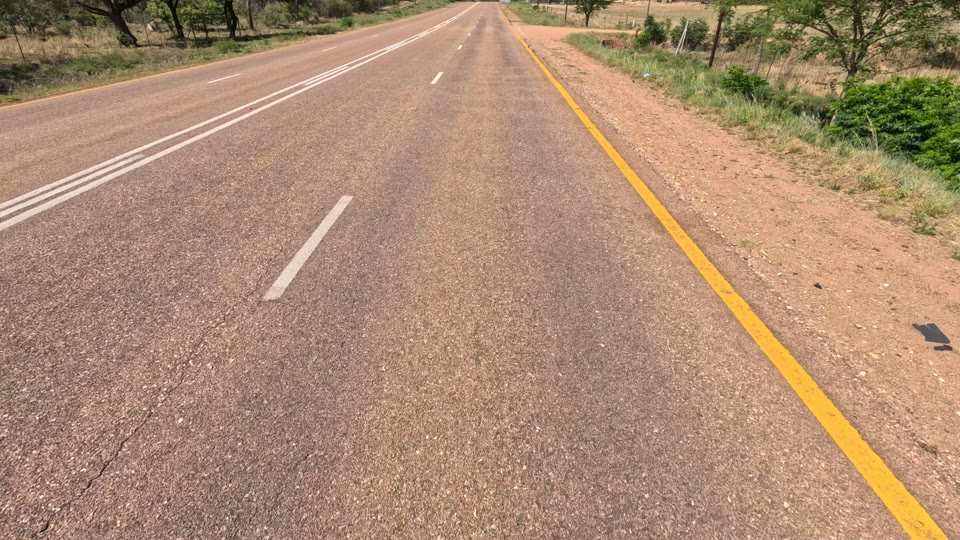
Rut 5.1 · 2.8
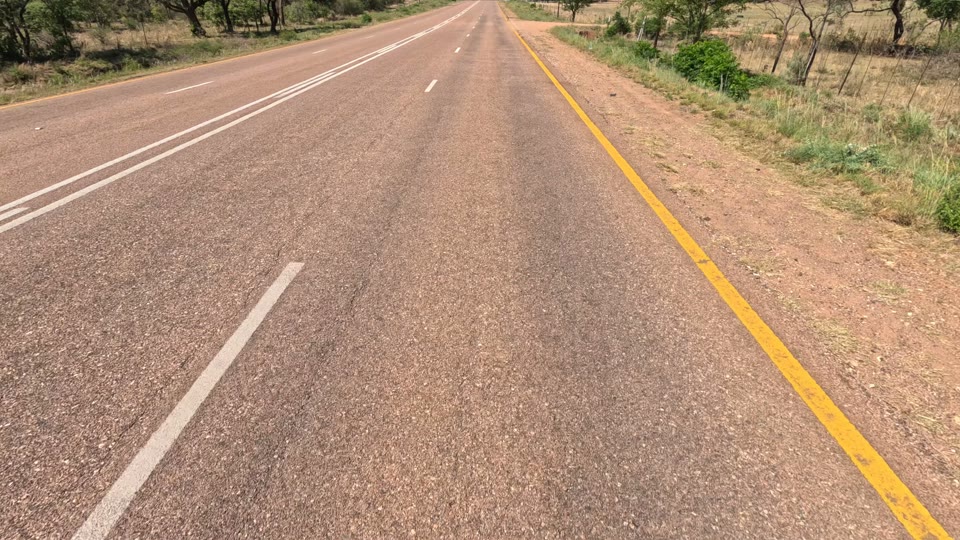
Rut 5.2 · 3.1
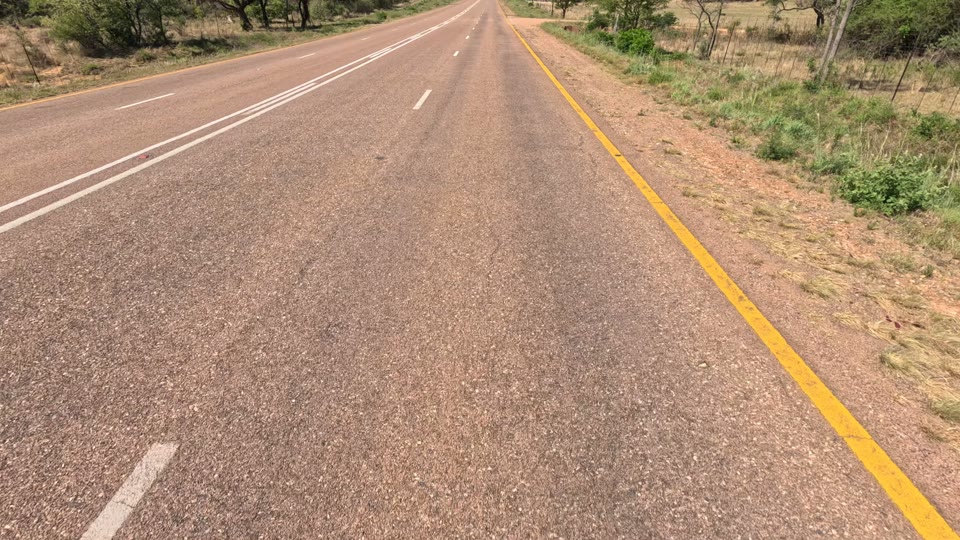
Rut 7.2 · 2.5
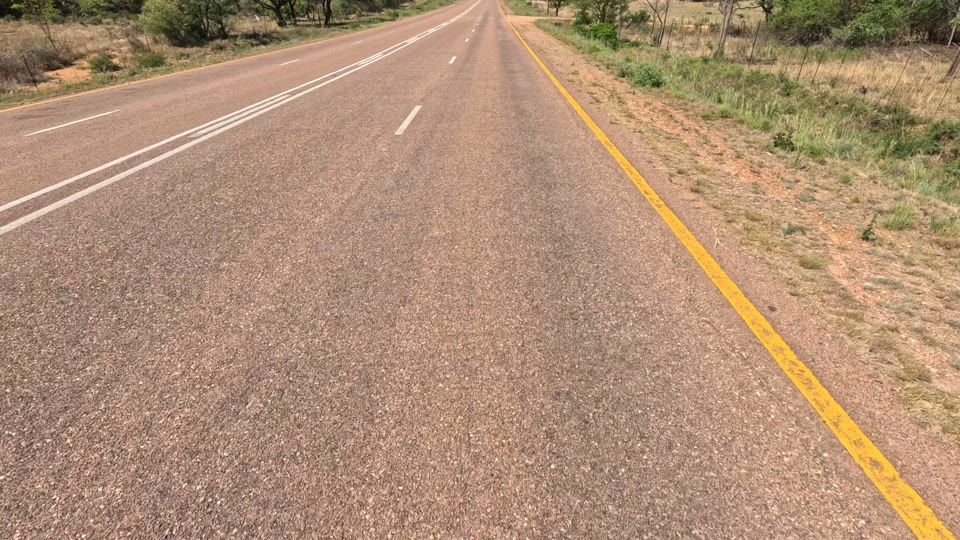
Rut 6.3 · 2.5
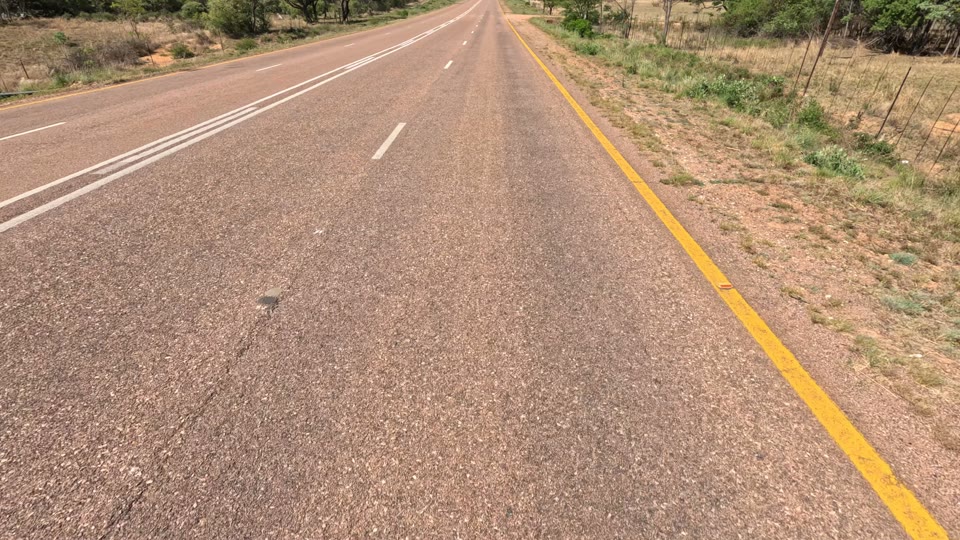
Rut 7.5 · 4.7
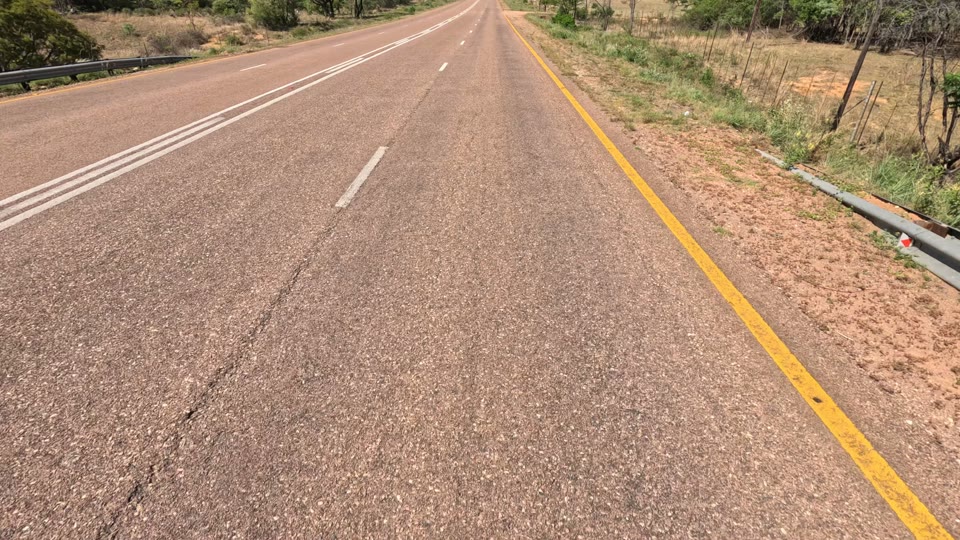
Rut 8.1 · 6.0
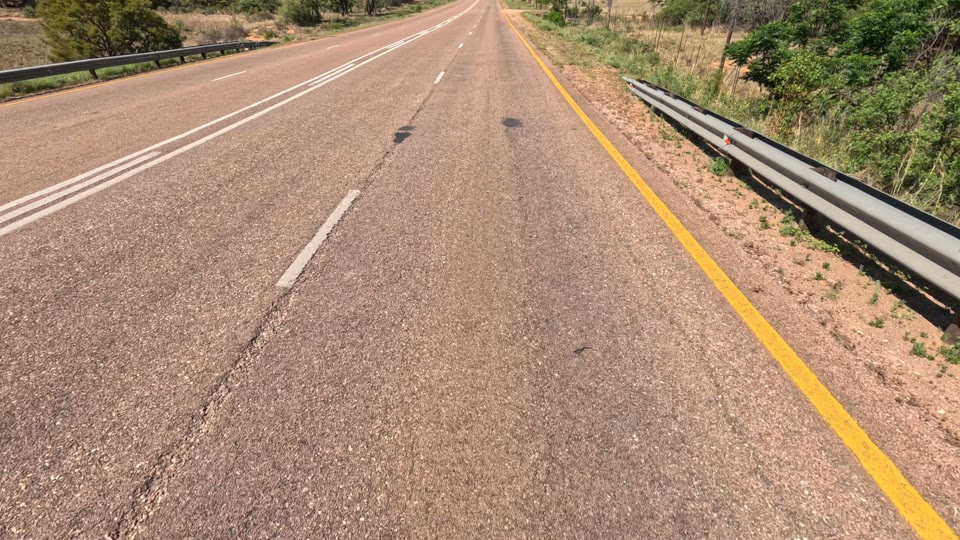
Rut 6.0 · 5.3
Frame record
- Camera and direction (FC, SC, BC · P, N)
- Distance along the GPS track
- Video time (PTS) and UTC
- Latitude and longitude
Survey reading
- Station on the survey file
- IRI, MPD, SMTD, rut, FWD
- Left and right wheel path
- GPS where the file carries it
One chainage
- Readings remapped onto the frames’ chainage range, using GPS where linked video metadata exists
- Interpolated values at any selected chainage
- One selection drives every view
Why
One chainage. Every source.
A rating is only as good as the evidence in front of the assessor. When the photo and the measurement refer to the same place, a high IRI can be checked against the surface that caused it, and a visible defect against the profile beneath it.
See and measure together
Every camera tile shows its frame’s own chainage and its offset from the selection. The trend charts read IRI, MPD, SMTD, rut and altitude at the same point.
No guessing where you are
A map shows the selected position on the road. Click the map or a chart, and the imagery and readings jump there together.
Consistent records
Ratings follow the TMH 9 form for the pavement type, are validated before they are finalised, and carry the segment and chainage they describe.
How
From download to report
Visual Assessor is a Windows desktop application. It works offline once a project is downloaded, and uploads finished work when it can reach the platform.
Download the project
Choose a client and project, then download its frame images and sensor data to the local library. The workspace shows a data inventory per camera, per sensor file and per road.
- Downloads pause and resume; low disk space pauses the download instead of failing it.
- A frame is shown only when its camera (FC, SC, BC) and direction (P, N) are known, from the video name, the frame name or the file’s tags.
Move along the road
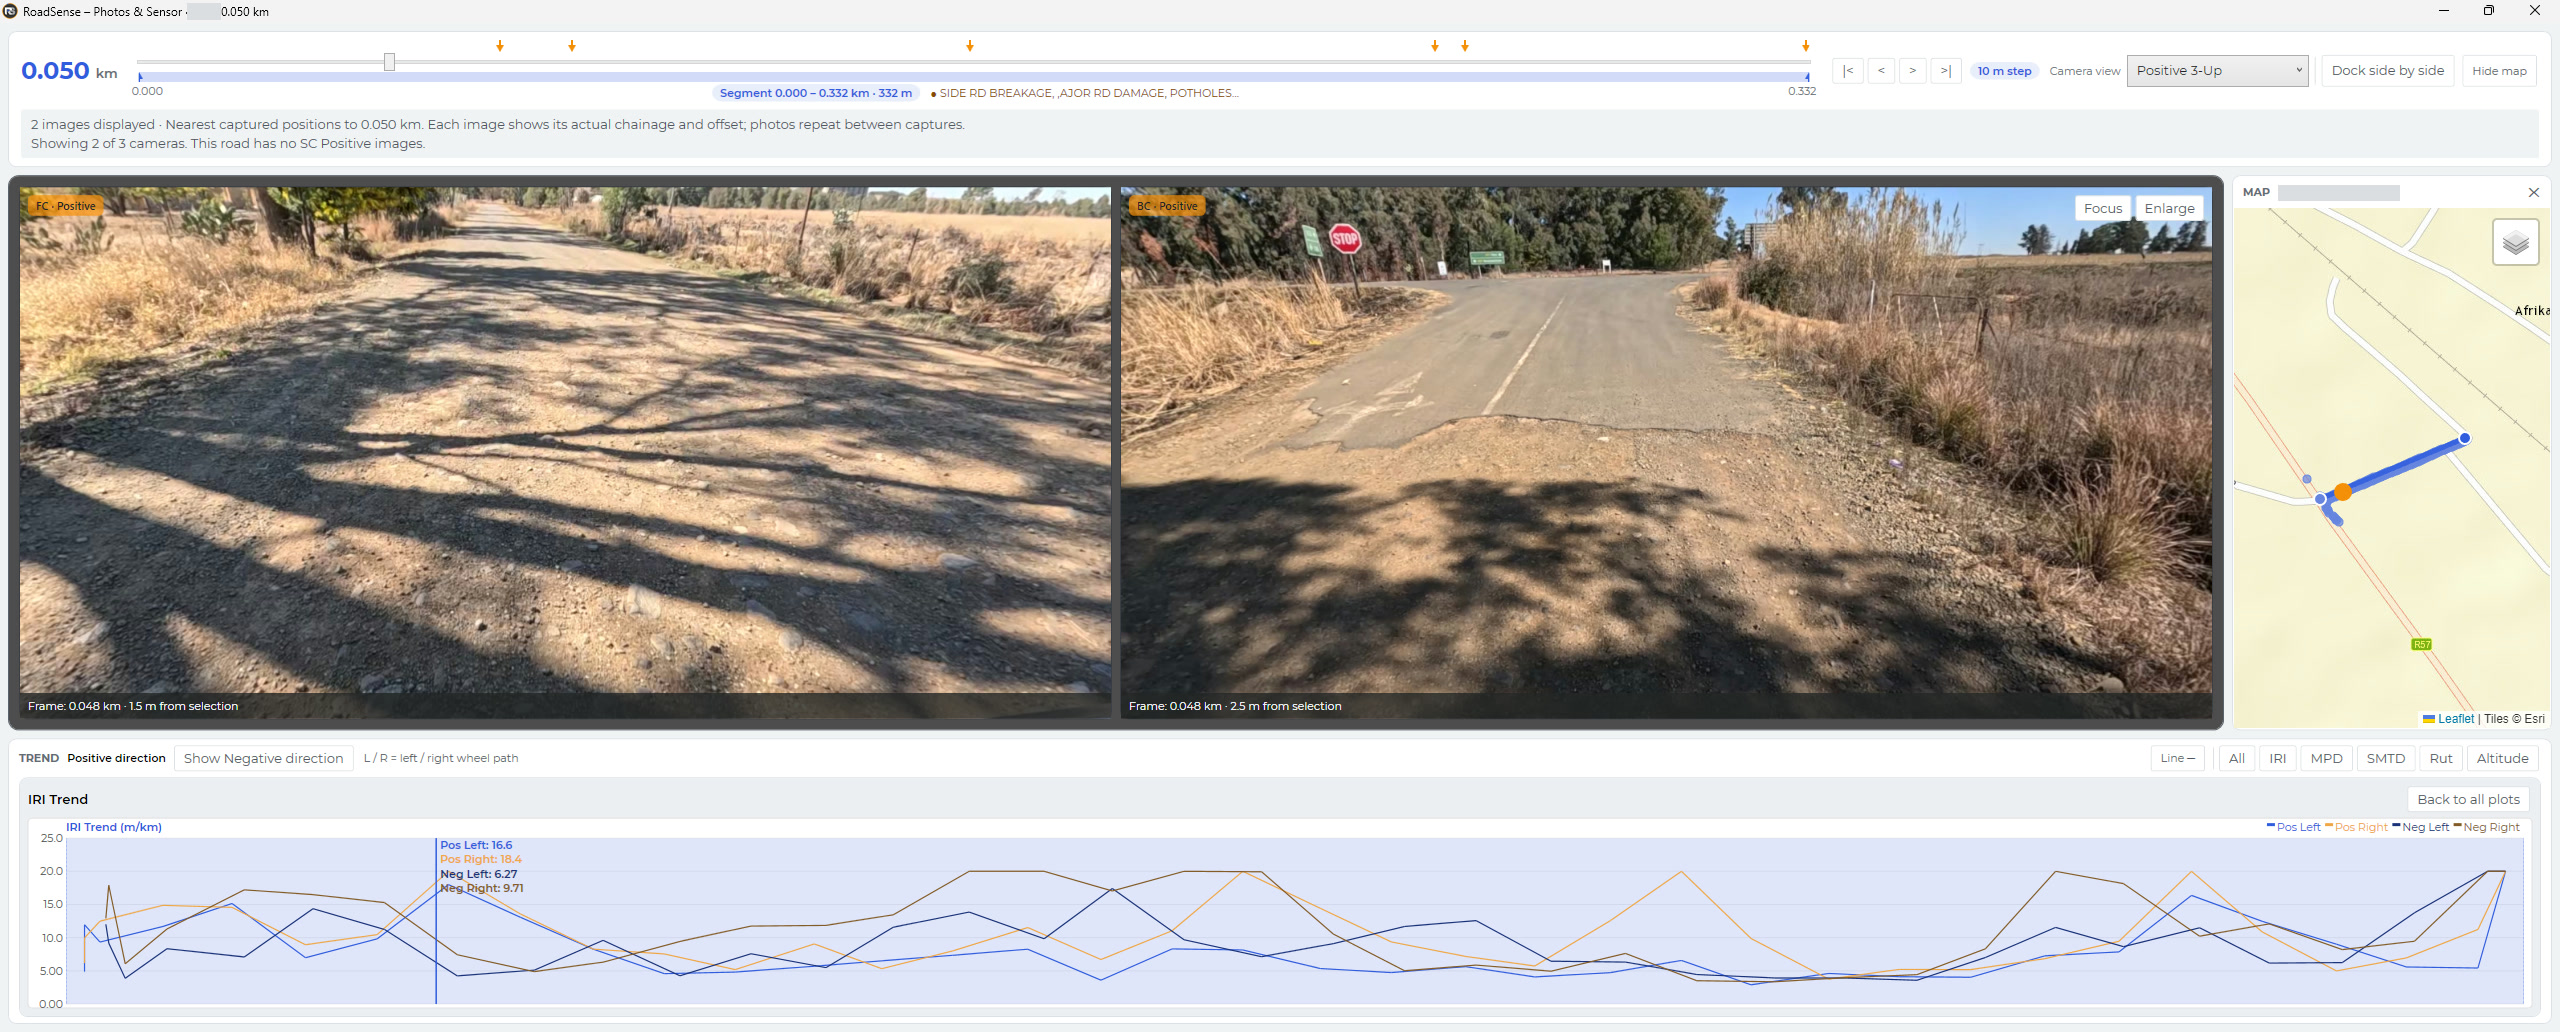
The Photos & Sensor window opens at the start of the road. Step along it and every view follows the same chainage.
- ← → step 10 m; PgUp PgDn ten steps; Home End.
- Camera views: six-up, negative strip or positive strip (Ctrl+1–3), or one selected camera.
- Focus one chart: IRI, MPD, rut or FWD (Ctrl+4–7).
- Enlarge a tile to the full-screen viewer, with measuring tools for distance, width, potholes, edge breaks and patch area.
Rate the segment
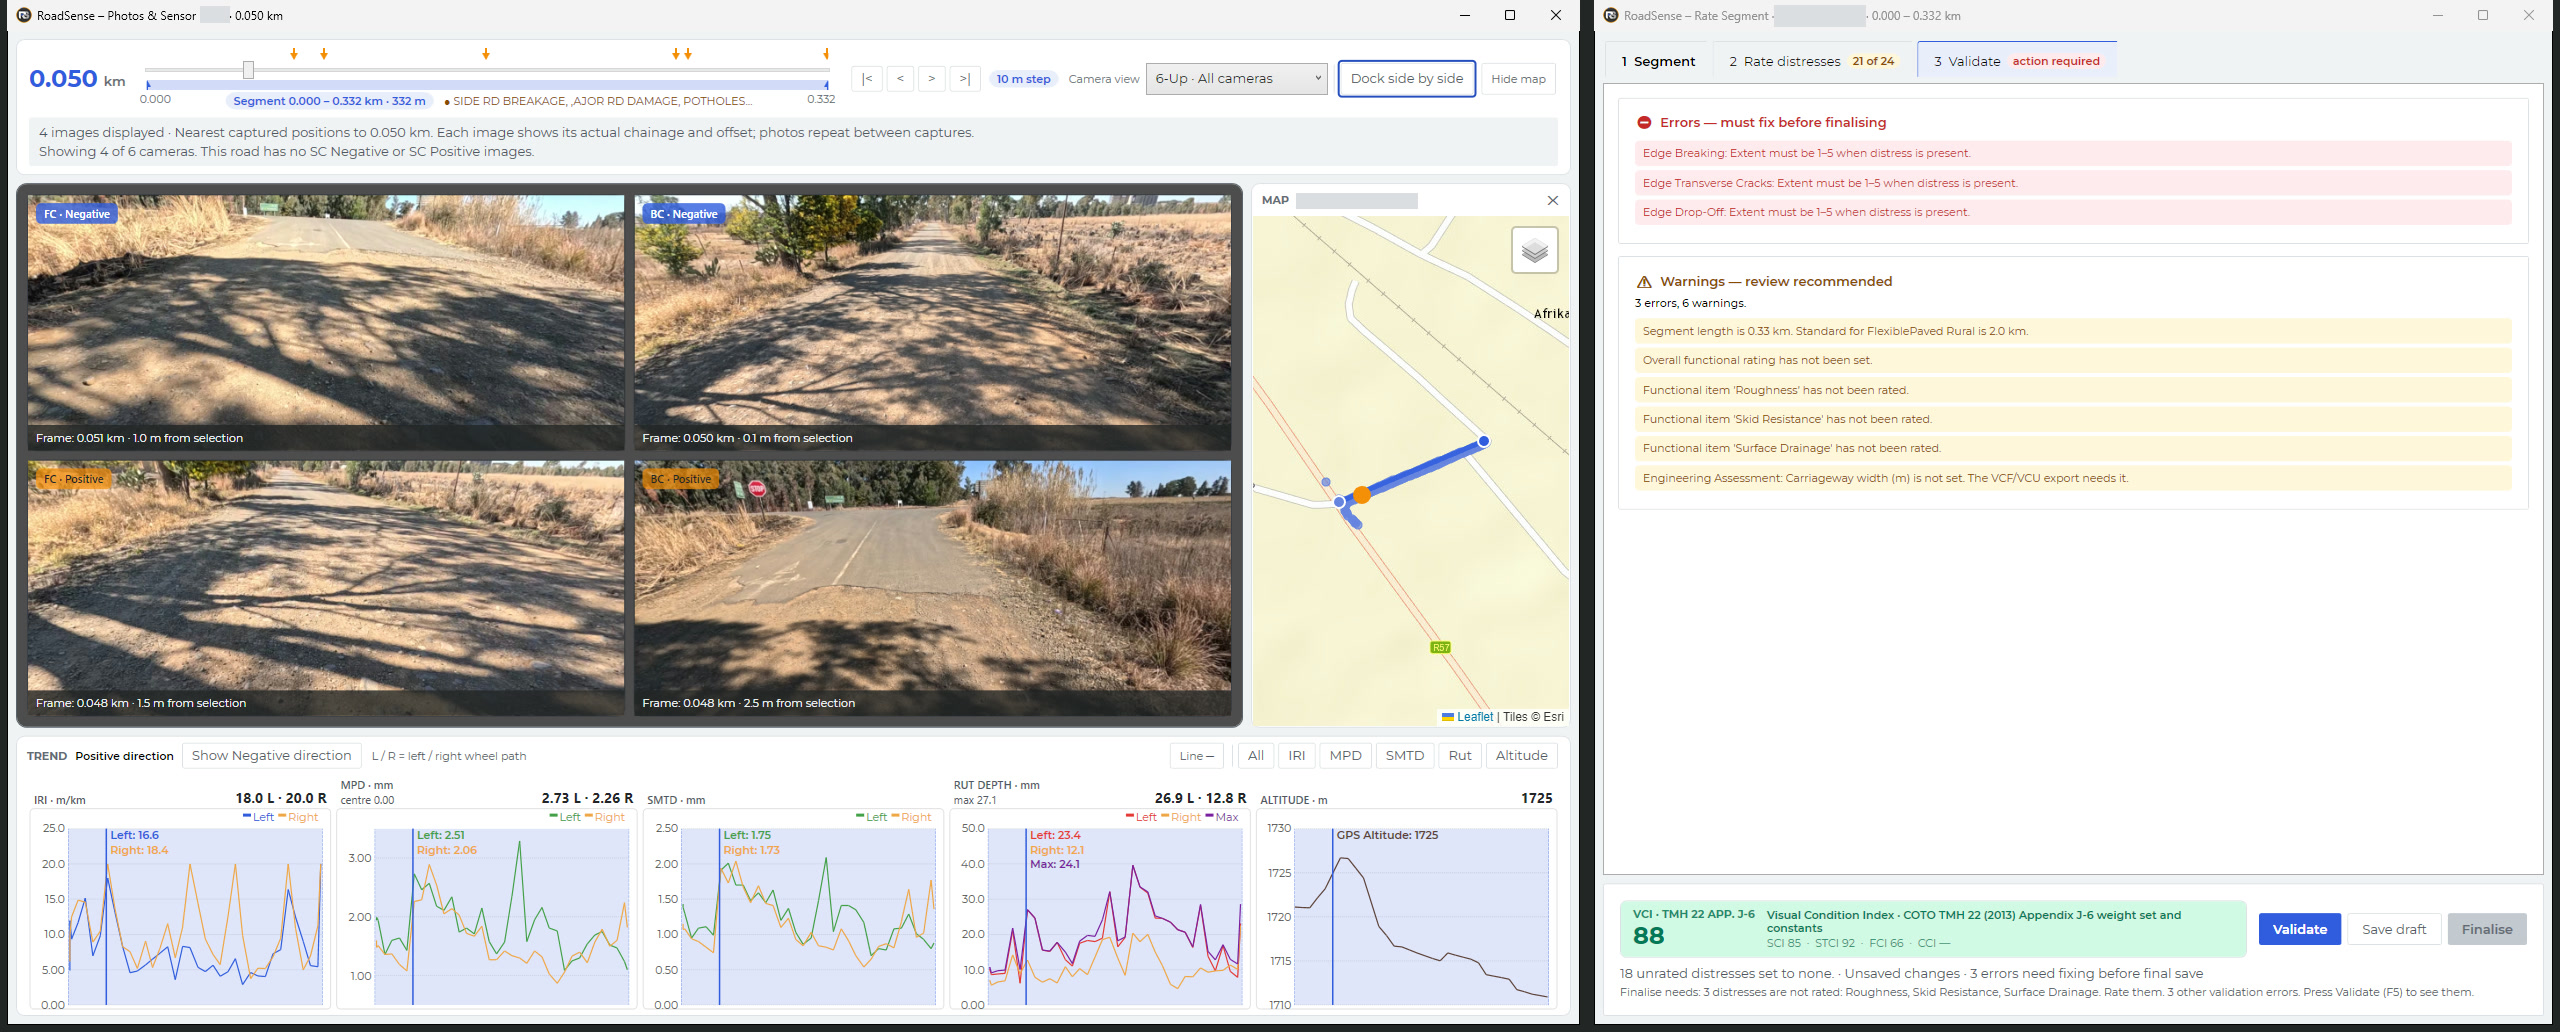
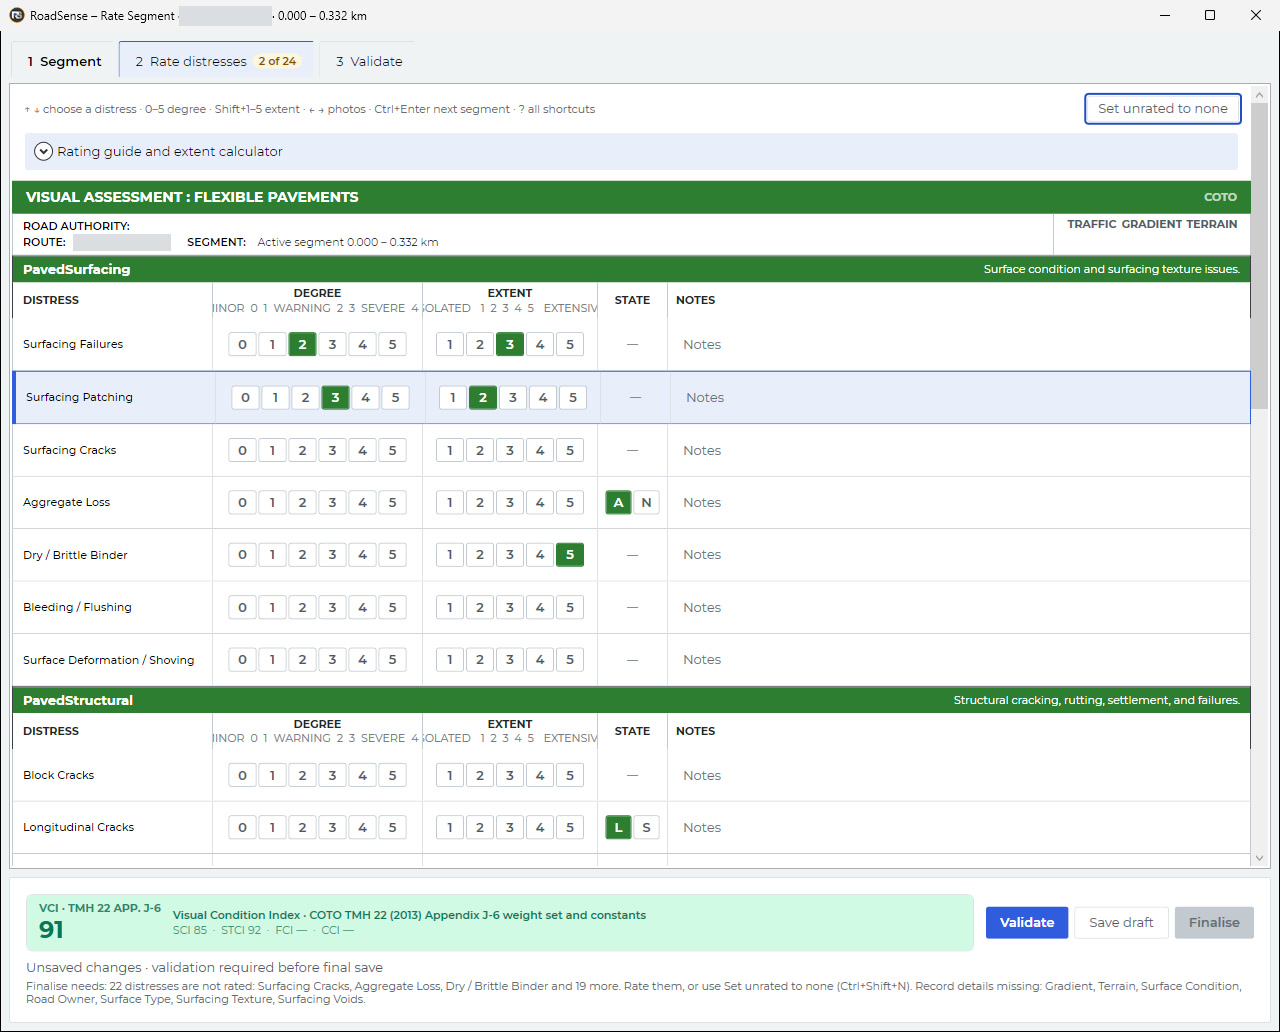
Dock the Rate Segment window beside the imagery. Set the segment (road, start and end chainage, pavement type, environment), then rate each distress.
- Forms follow TMH 9: Part B flexible pavement, Part D block pavement, Part E unpaved road.
- Degree 0–5 and extent Shift+1–5 by keyboard; Ctrl+Shift+N sets the rest to none.
- A live Visual Condition Index updates as you rate: TMH 22 (2013) Appendix J-6 weights for flexible pavement, ReCAP (2020) weightings for unpaved and block.
Validate, save, finalise
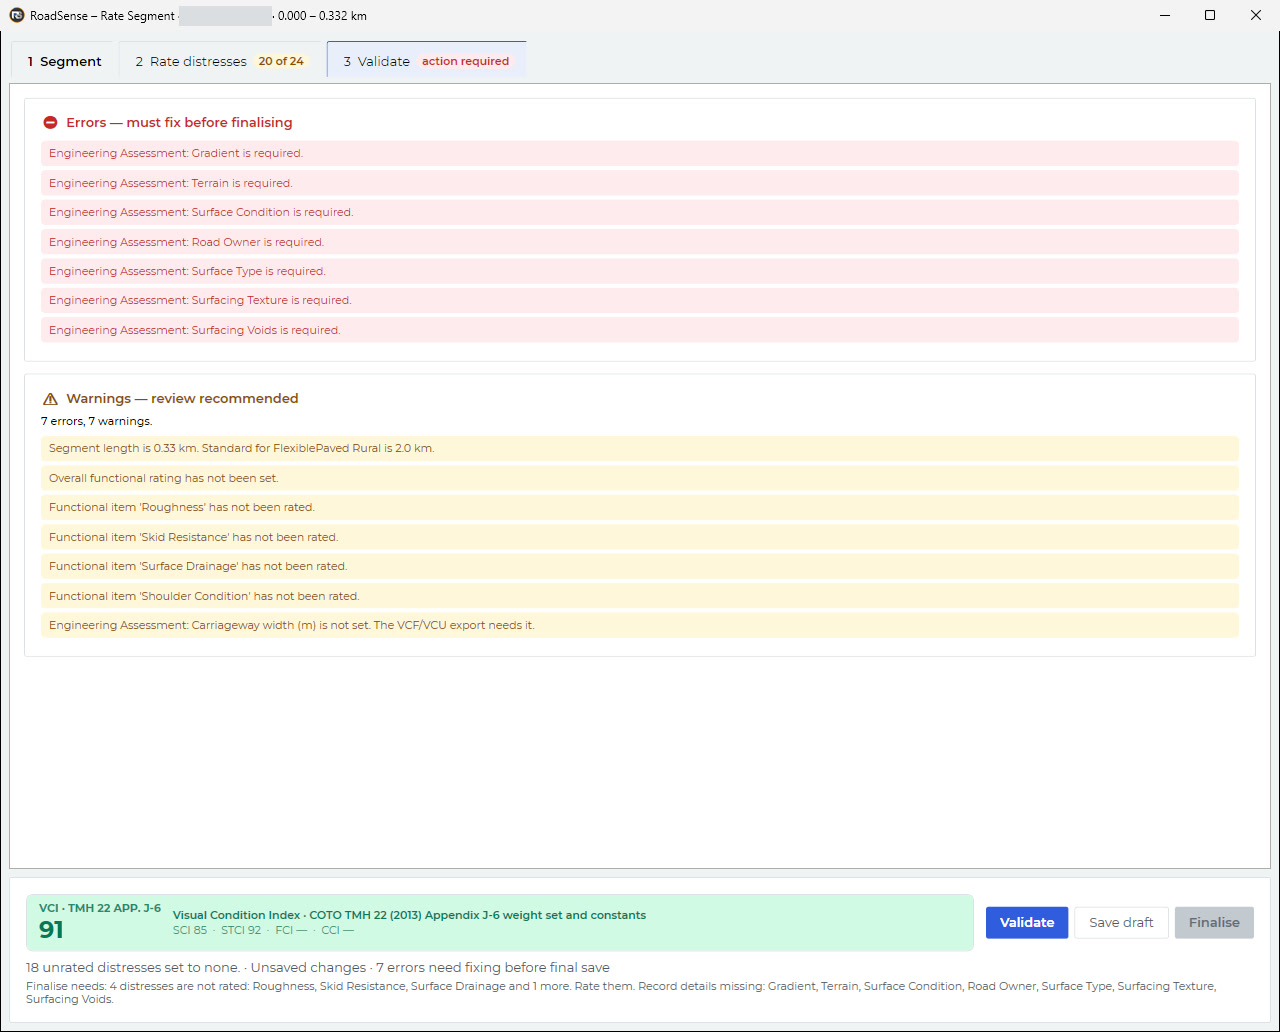
Validation lists errors that must be fixed and warnings worth reviewing. Save a draft at any time; finalise when the segment is complete, then go to the next segment.
- F5 validate · Ctrl+S save draft · Ctrl+Shift+S finalise · Ctrl+Enter validate, save and next.
- Uploads retry on their own (after 2, 2, 5 and 10 minutes) and the status bar shows what is pending.
Report from the platform
Each finalised assessment uploads to the RoadSense platform with its road, segment, chainage, lane, direction, rating and distress ratings. On the platform, a road’s Assessment tab lists the visual assessments held for that road, reached through the road register attached to the project.
- The tab shows a rating summary, a chainage strip per lane coloured by rating, and each record’s distress table.
- Assessments and reports are signed by a registered Professional Engineer (Pr Eng, ECSA).
Standards
What the forms implement
| Reference | Where it is used in Visual Assessor |
|---|---|
| TMH 9 (COTO, CDF May 2016) | Compliant rating forms. TMH 9, the South African Manual for Visual Assessment of Road Pavements (Committee Draft Final, May 2016) of COTO, Parts A–E. The forms implement Part B flexible pavement, Part D segmented block pavement and Part E unpaved road, with degree and extent as set out in Part A; Part C (concrete) is not implemented. Distress lists, standard segment lengths and the rating guide follow those parts. Step-by-step: how to run a TMH 9 visual assessment. |
| TMH 13 (COTO, CDF May 2016) | Compliant imaging, Part G. Automated Road Condition Assessments, Part G Imaging: frames kept every 5 m along the GPS track (Table G.2 asks for ≤ 5 m), at 5312 × 2988 pixels (minimum 800 × 600), each stored with its distance, video time, UTC and coordinates. Part B Positioning (sub-metre DGPS) is met only where an RTX/DGPS backbone positions the frames; camera-GPS frames are not claimed to meet it. No claim is made that the survey vehicle is a validated TMH 13 Class 1 instrument. |
| TMH 22 (2013) App. J-6 | Visual Condition Index weight set and constants for flexible pavement, shown as “VCI · TMH 22 App. J-6”. |
| ReCAP (2020) | Raters’ Guideline recommended weightings for unpaved roads (Part E, Table E.7-1) and block pavement (Part D, Table D.5-1), shown as “VCI · ReCAP 2020”. The guideline notes that an agency may modify them. |
Assessments and reports are signed by a registered Professional Engineer (Pr Eng, ECSA). Visual Assessor records the assessor’s judgement. It does not rate distresses automatically: the measuring tools report distances and areas, but never set a degree or an extent. The survey readings shown beside the imagery come from the project’s own survey files; the assessment is stored as a separate record.
Questions
Frequently asked
What is a TMH 9 visual assessment?
TMH 9 is the COTO Manual for Visual Assessment of Road Pavements. Visual Assessor's rating forms follow the Committee Draft Final of May 2016: Part B for flexible pavements, Part D for block pavements and Part E for unpaved roads. The assessor records a degree and an extent for each distress on the segment. See the TMH 9 standard page and the guide how to run a TMH 9 visual assessment.
How does Visual Assessor link survey imagery to survey data?
Each video frame is kept at a fixed distance along the vehicle's GPS track, with its distance, video time and coordinates. Visual Assessor maps the project's IRI, MPD, SMTD, rut and FWD readings onto the frames' chainage, so one selected chainage drives every camera view, the map and the trend charts.
Which parts of TMH 13 apply to the imagery?
TMH 13 Automated Road Condition Assessments (COTO, Committee Draft Final, May 2016), Part G Imaging. The Tower keeps one frame every 5 m along the GPS track at 5312 × 2988 pixels, above the Part G Table G.2 minimum of 800 × 600 at a spacing of 5 m or less. Positioning to Part B needs a DGPS or RTX backbone; frames positioned by the camera's own GPS are not claimed to meet Part B.
Does Visual Assessor detect distresses automatically?
No. The assessor rates each distress. The measuring tools report distances and areas from the photographs, but they never set a degree or an extent.
Who signs the assessments?
Assessments and reports are signed by a registered Professional Engineer (Pr Eng, ECSA).
Where do finished assessments go?
Finalised assessments upload to the RoadSense platform with their road, segment, chainage, lane, direction and distress ratings. On the platform, a road's Assessment tab lists the visual assessments held for that road, reached through the road register attached to the project.
How the survey data gets onto the register
RSP, FWD and roughometer data, fitted to the shapefile register, managed as a network survey and exported to TMH formats.
From survey video to a bird’s-eye road scan
The same survey video, turned into a continuous scan of the road surface for close inspection.
Film transcript (on-screen text; the film has music and no narration)
Roadsense Visual Assessor. See the road. Read the data. Survey imagery and survey measurements, brought to one position for visual assessment. What: frames on the survey line. A survey video carries its own GPS. One frame is kept every 5 m along the drive. Each kept frame records its distance, video time and position. The survey's 10 m readings are matched to the same positions. One frame, one reading: frame 3,460 m along the drive, video time 565.90 s, UTC 07:23:58.2; 10 m reading IRI 3.2 and 2.2 m/km, rut 7.2 and 2.5 mm, MPD 2.46 and 2.02 mm, matched by GPS. Equals one position. In Visual Assessor, both are read at one selected chainage. Why: one chainage, every source. Each camera tile shows its frame's own chainage and offset from the selection. IRI, MPD, SMTD and rut are read at the same chainage, left and right wheel path. How: move along the road 10 m at a time; click a point on the map or a trend chart and every view jumps there. Rate what you see: dock the Rate Segment window beside the imagery, rate each distress by keyboard on the TMH 9 form, degree and extent. A live Visual Condition Index with TMH 22 Appendix J-6 weights. Validate. Save. Finalise. Finalised assessments upload to the RoadSense platform with their road, segment and chainage.